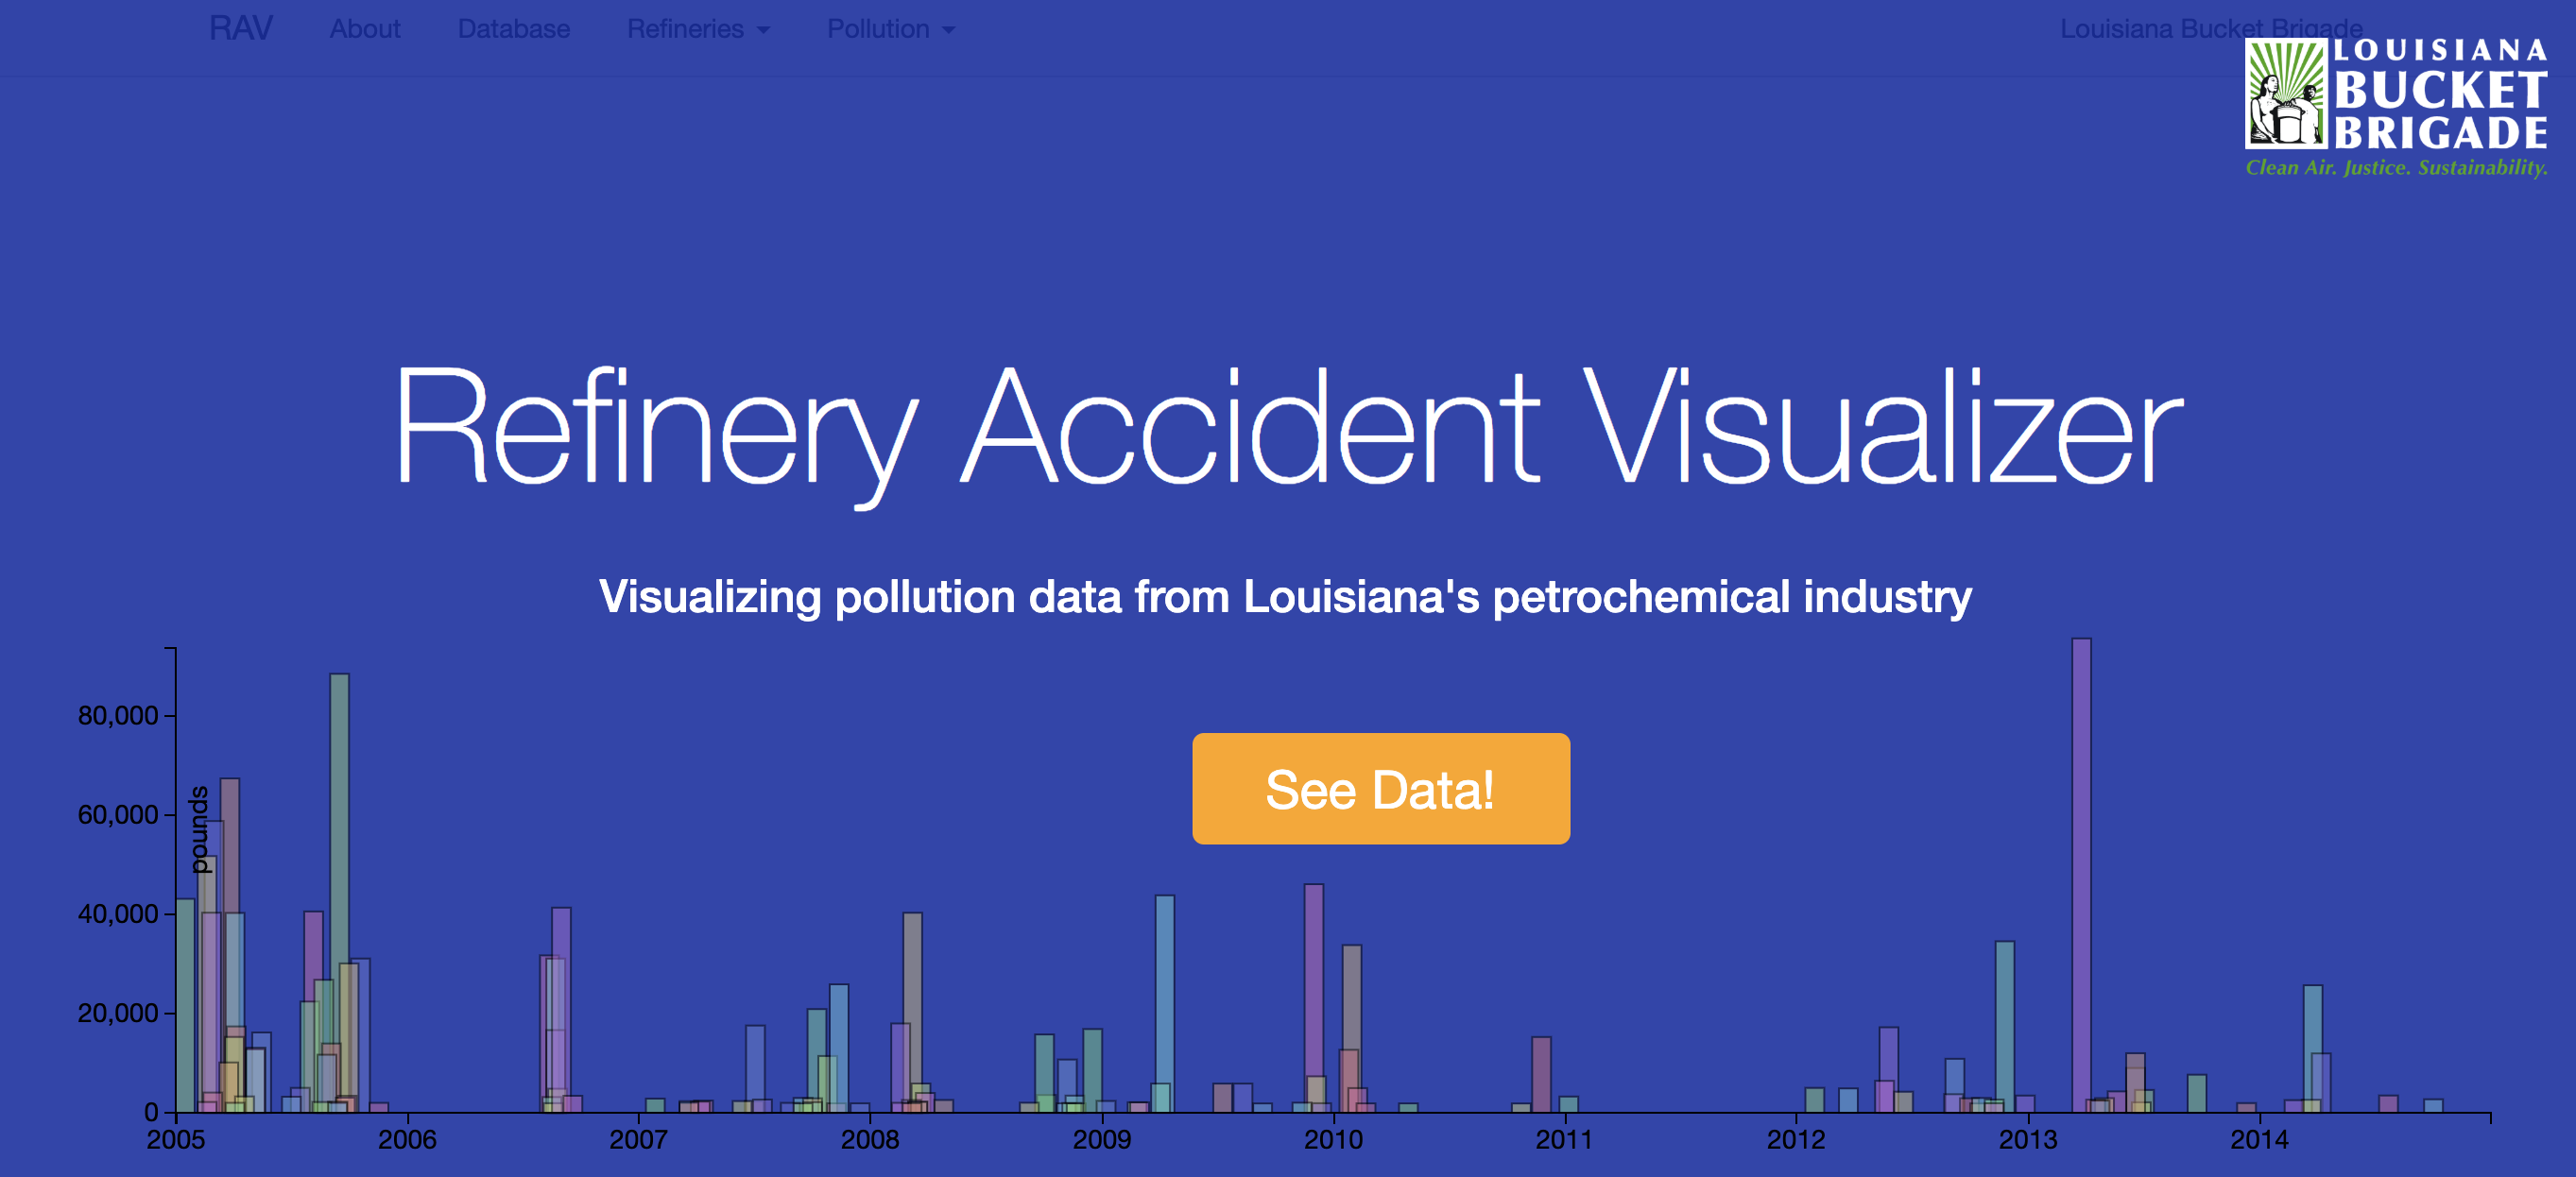
Refinery Accident Visualizer
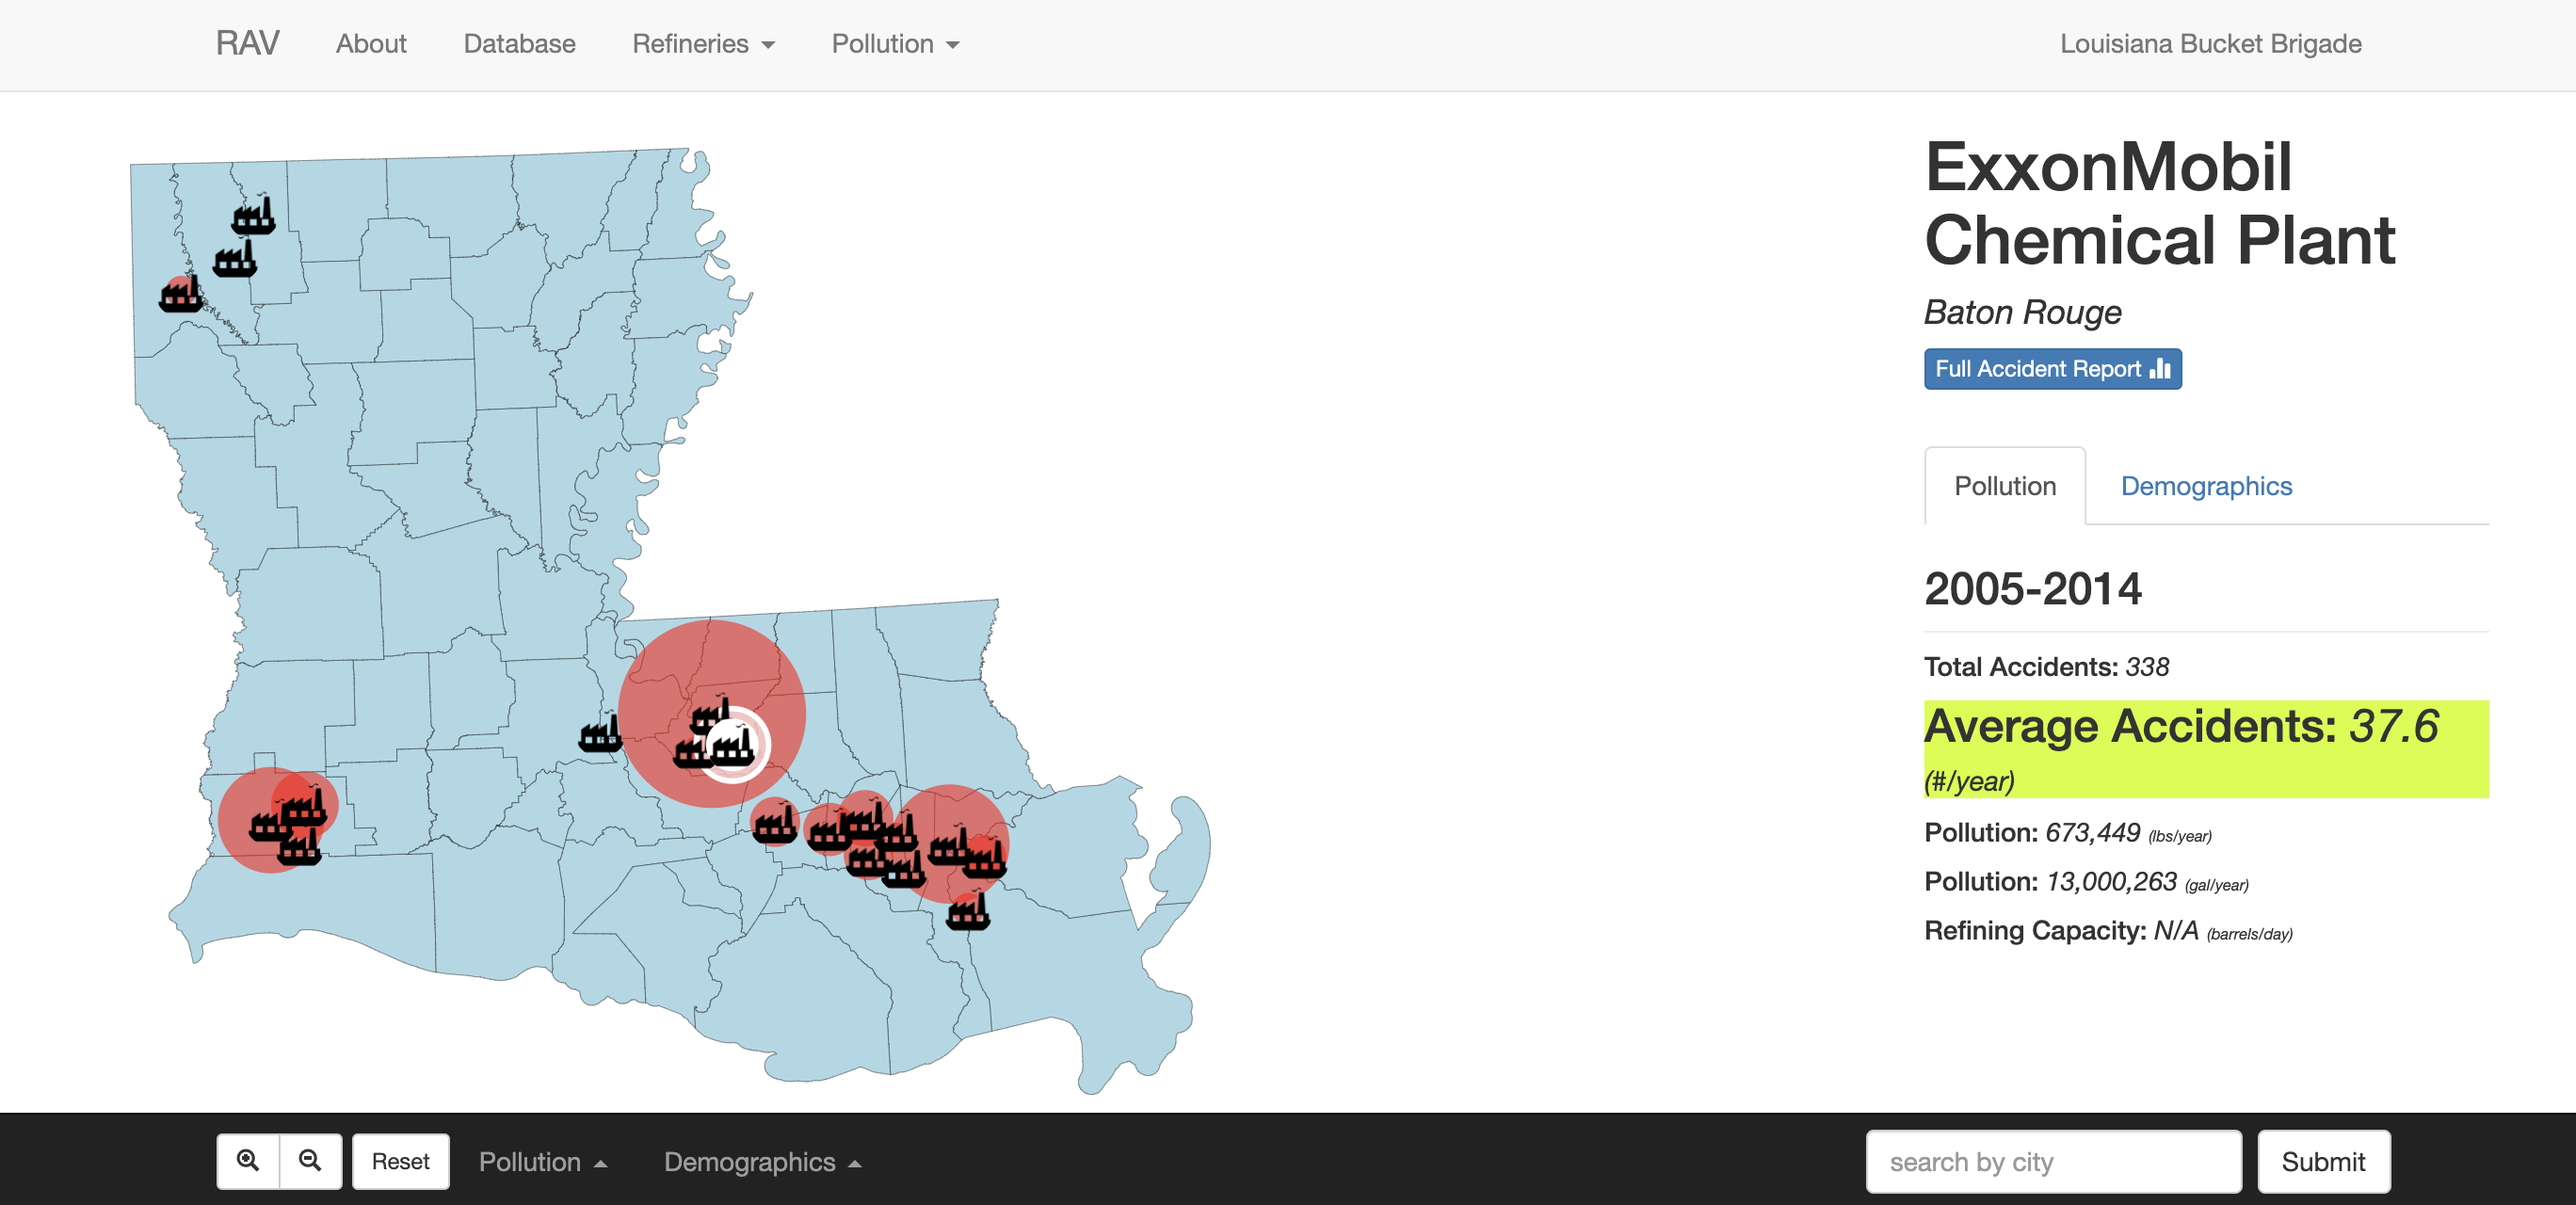
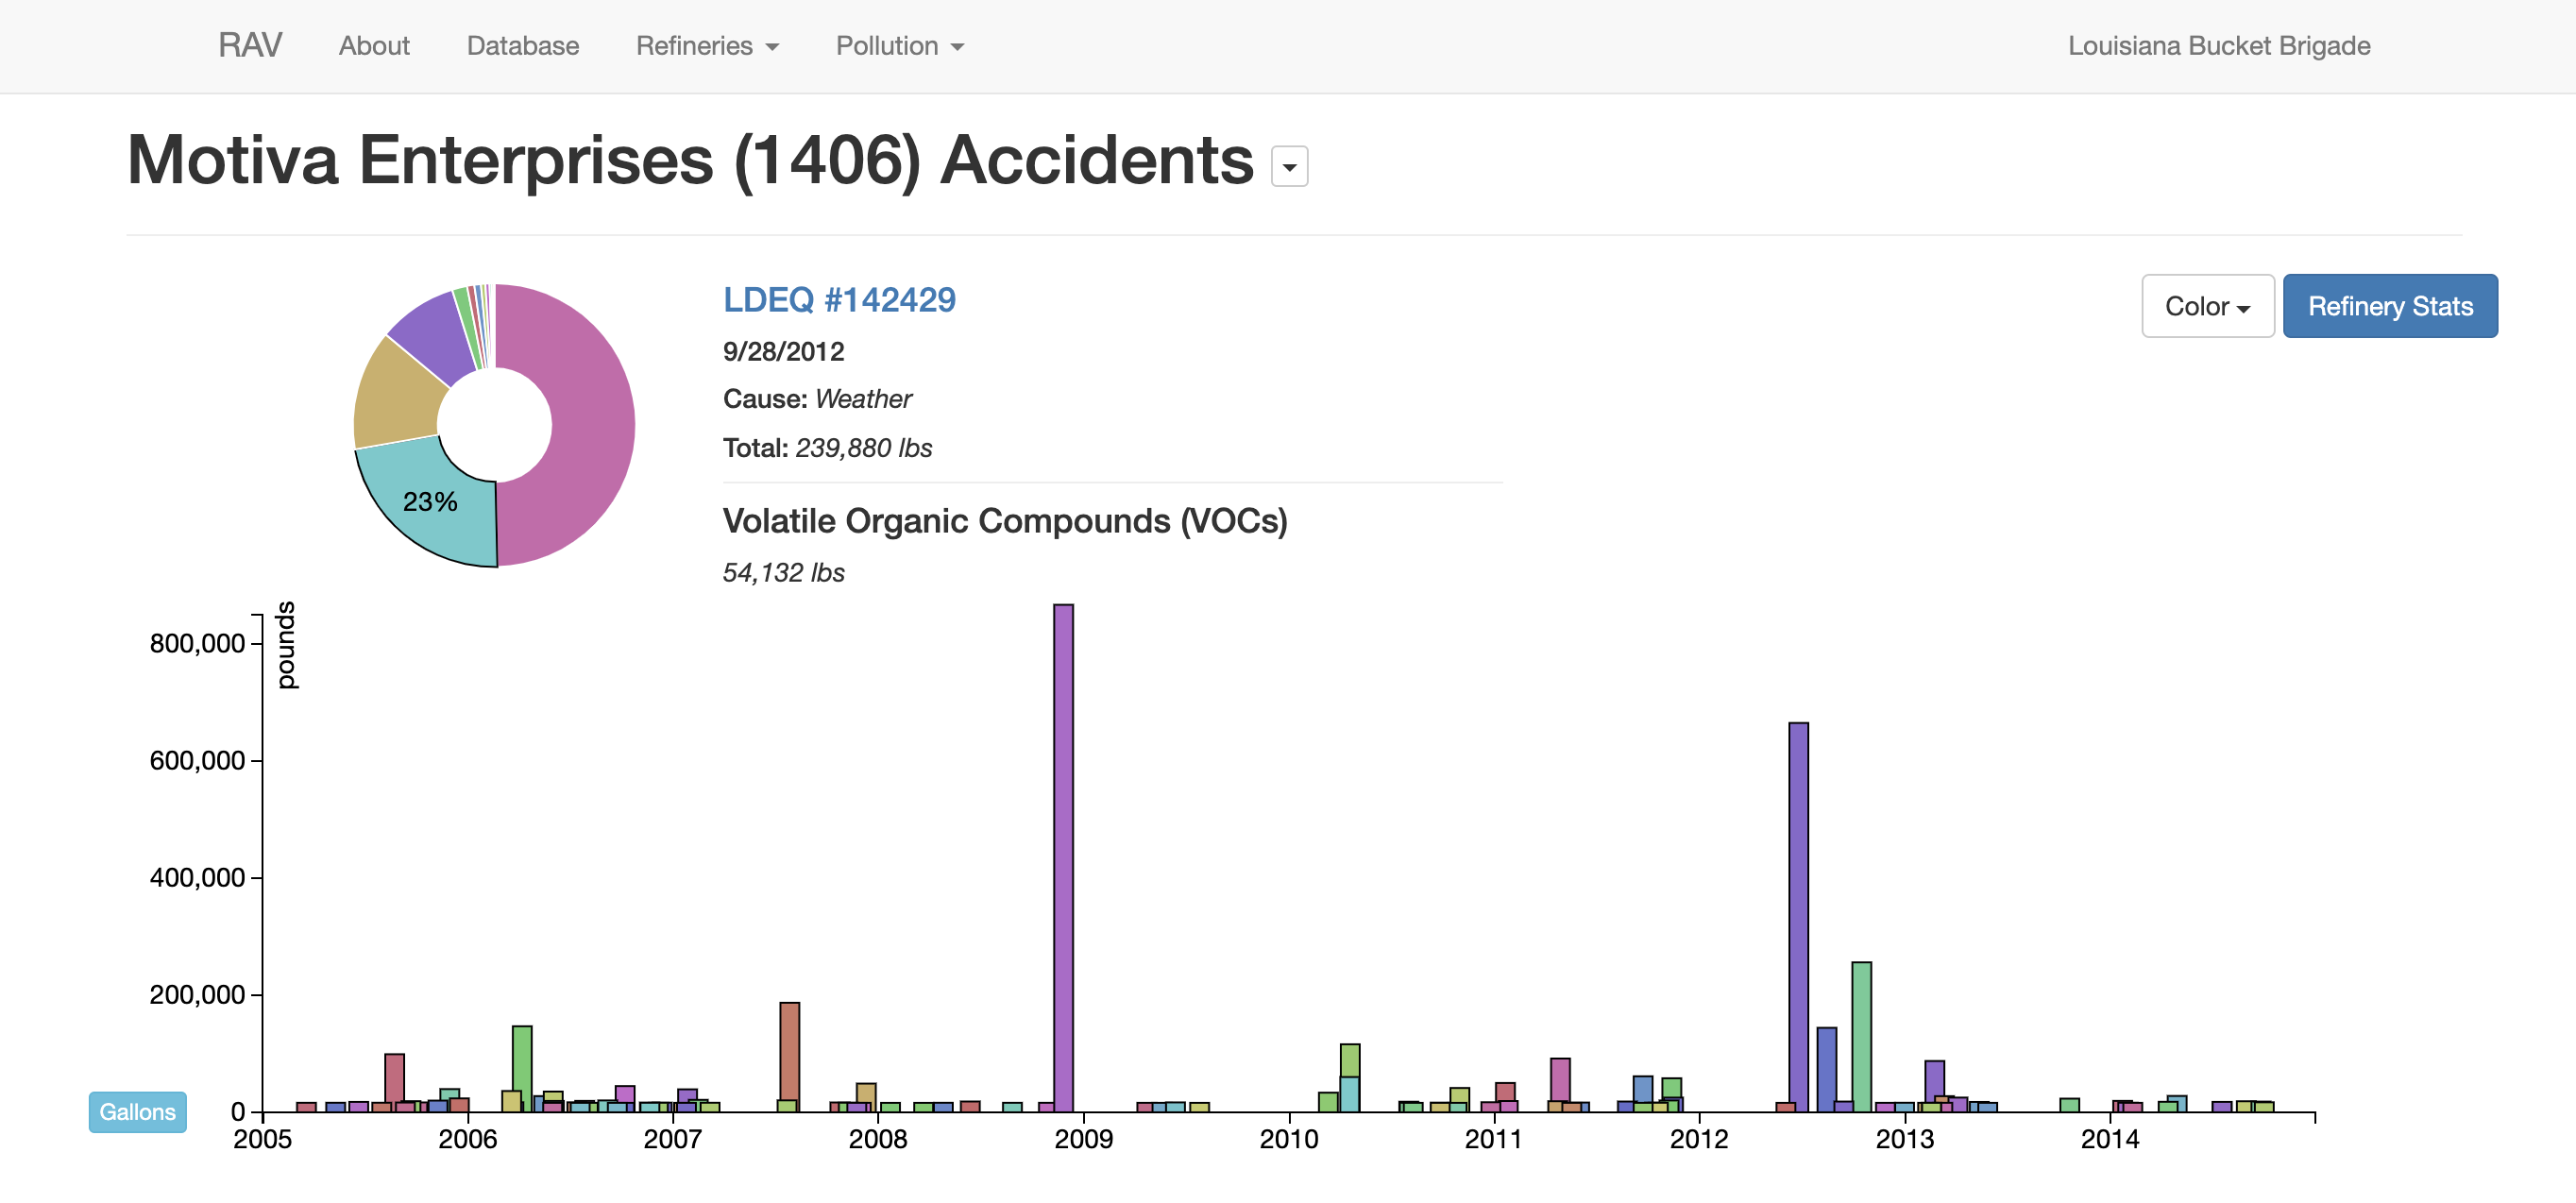
The Refinery Accident Visualizer is a d3.js visualization of petrochemical accidents in Louisiana from 2005-2015. The interactive map provides refinery-level statistics, chemical compounds comprising each accident, as well as demographic data of the communities (typically low-income people of color) surrounding these refineries.
The data comes from the Refinery Accident Database (RAD), which compiles refineries’ own accident reports submitted to the Louisiana Department of Environmental Quality (LDEQ). This database is a part of the Louisiana Bucket Brigade’s Refinery Efficiency Initiative to protect health of fenceline communities.